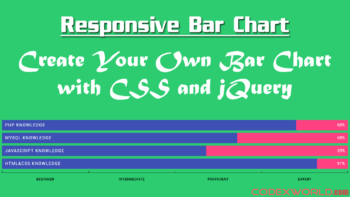
A bar chart is a graph that represents group data with vertical or horizontal bars. The bar chart helps to make the web application more user-friendly. To demonstrate comparison data among categories in percentage, the bar chart is the best choice.You don'...
Do you want support for the script installation or customization? Submit your request for customization of our scripts, support for the existing web application, and new development service.
You can connect with the support team directly via email at support@codexworld.com for any inquiry/help.